
Verified
14,122 Documented Killings in Syria, March 18, 2011 thru April 27, 2012
03:23 May 9 2012 Syria
Aggregate Report (تقرير إجمالي) Summary Report (تقرير ملخص) Killed (قُتِل) Eyewitness Report (تقريرشاهد عيان)


Description
14,122 documented killings in Syria, March 18, 2011 thru April 27, 2012Total Victims: 14,122
Total Places: 172
Total Months: 14
Data is available in
Google Earth (GE) format here (if you don't have GE, you can download it for free here)
Detailed spreadsheet format available soon
List of victims by place and date is available here
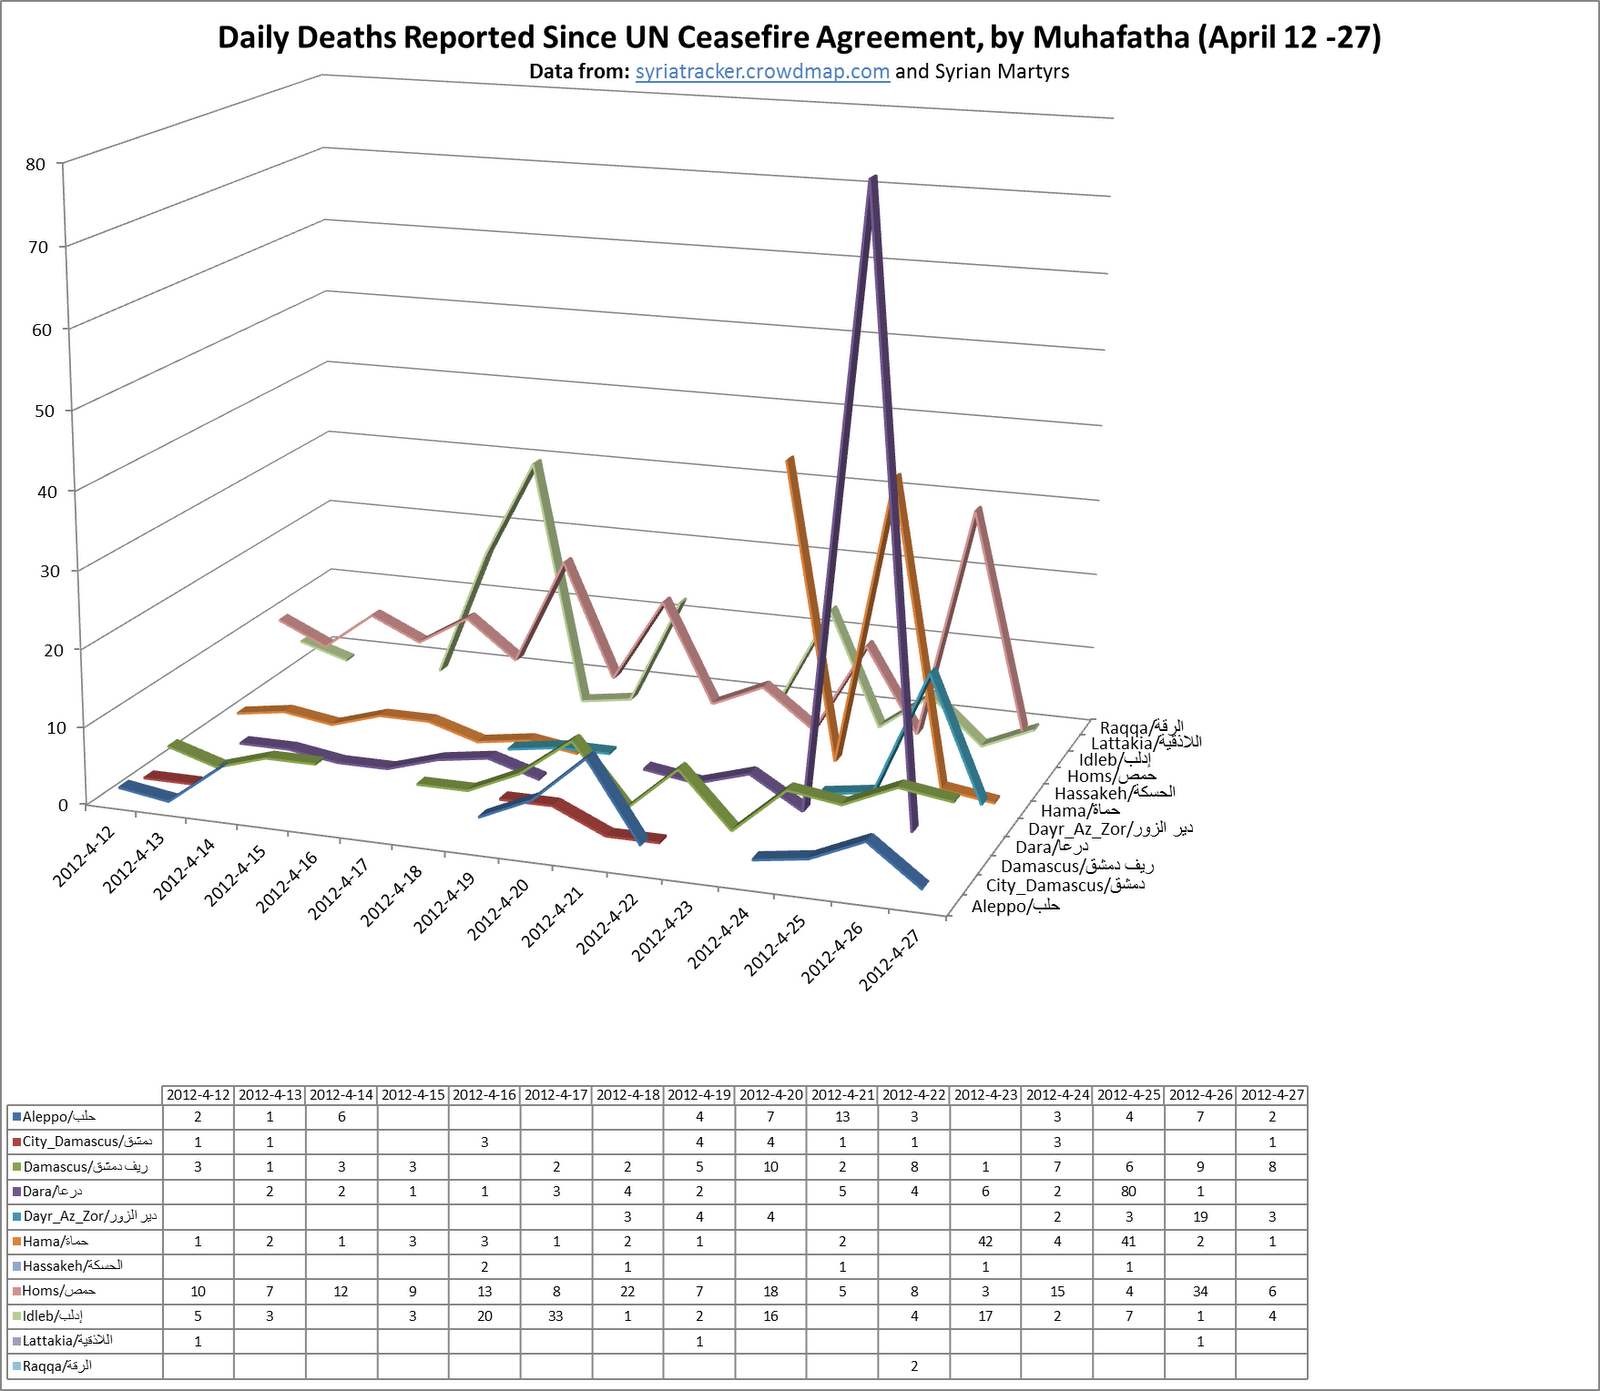
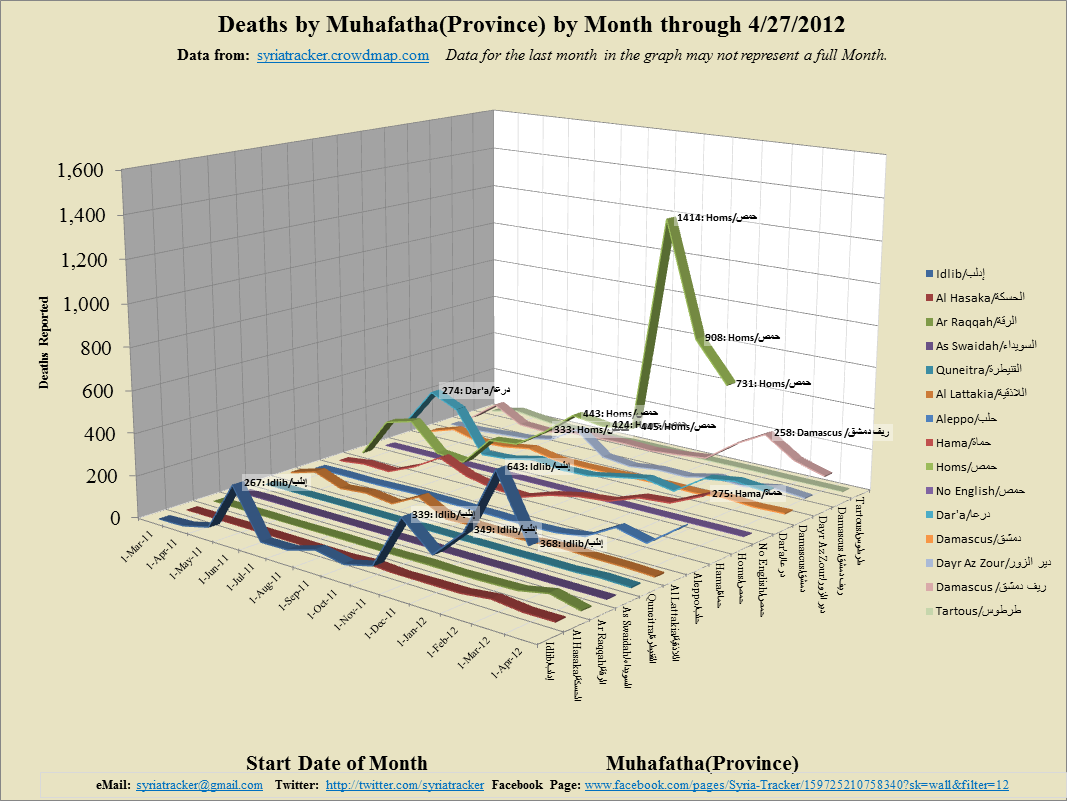
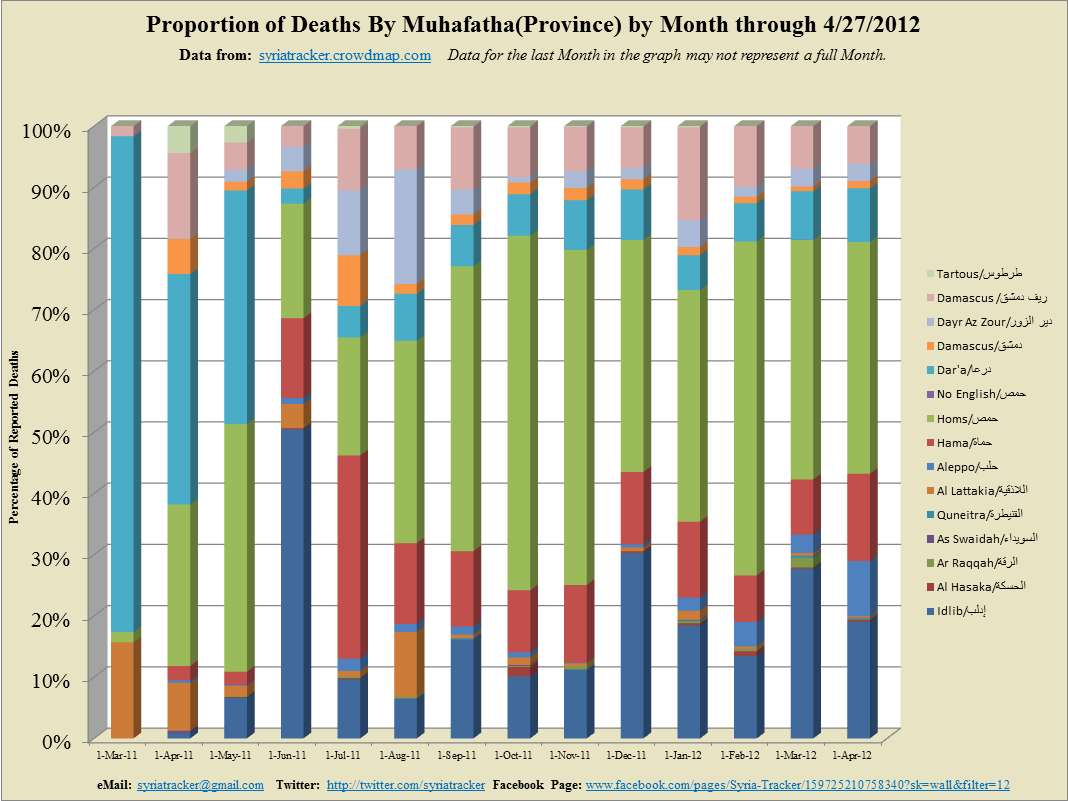
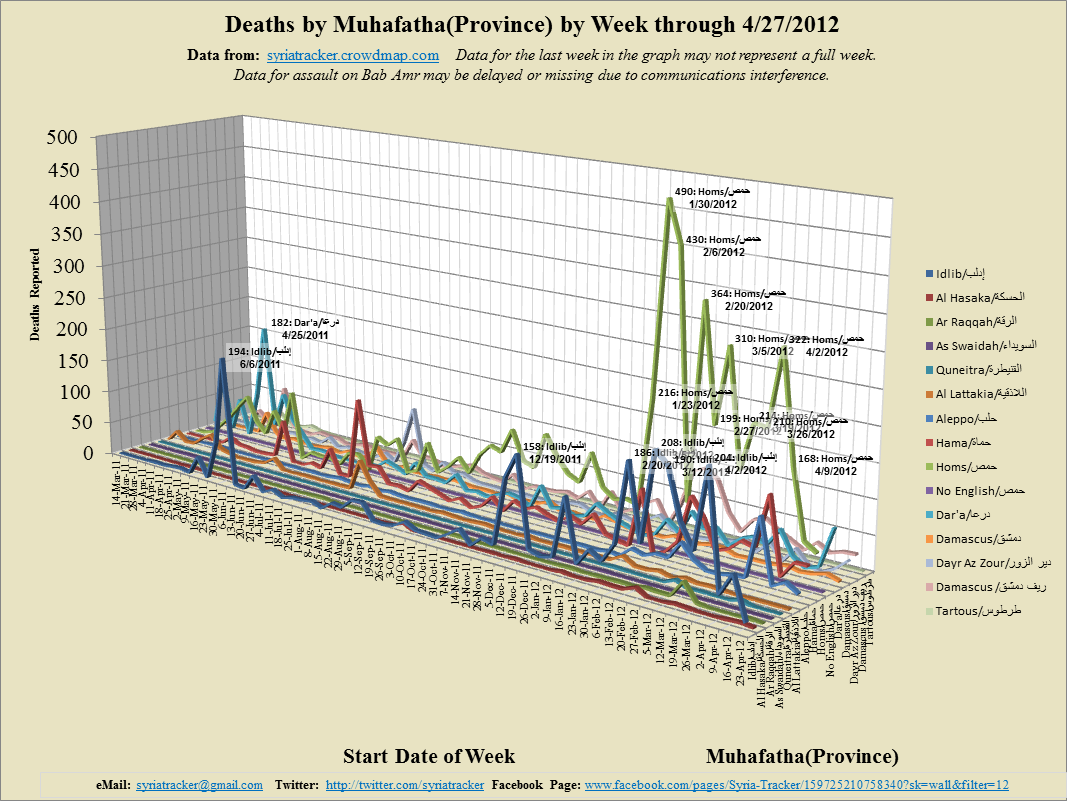
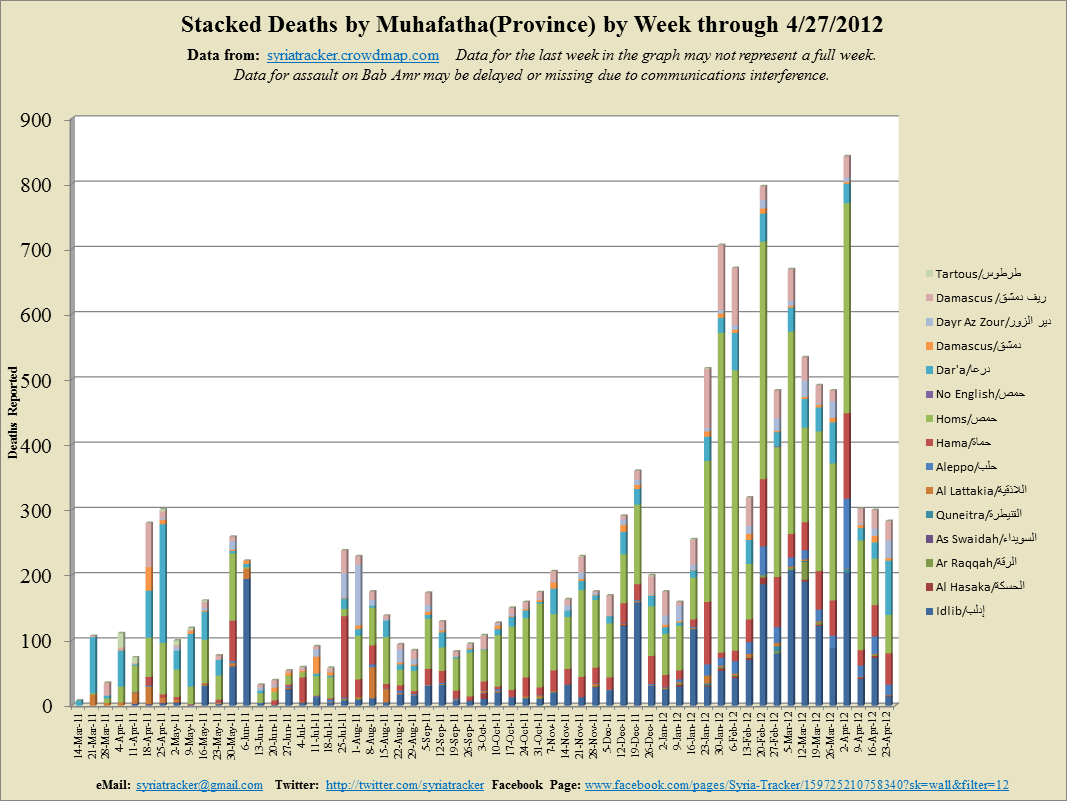
Analysis of Reported Deaths in Syria Tracker Data
We have recently been performing some geospatial analysis of Syria Tracker data and hope to be adding some regular reports in the coming weeks. In the meantime, we would like to share some initial findings, after a brief discussion of how locations are entered in Syria Tracker--
Locations
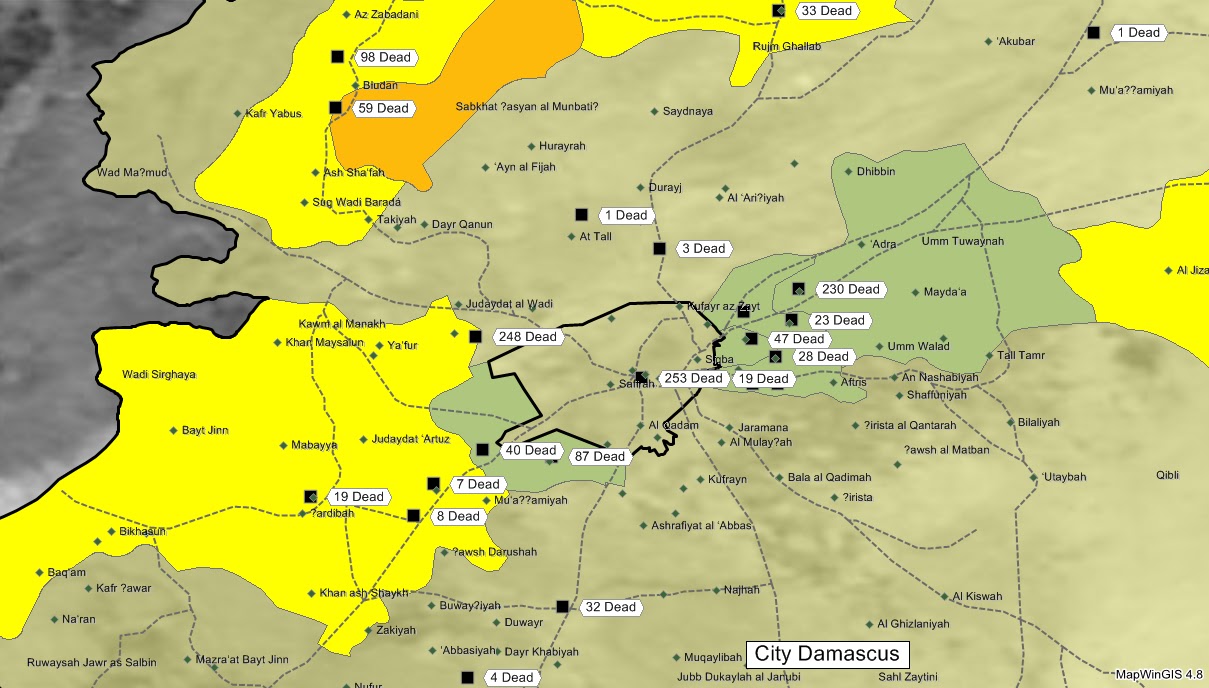
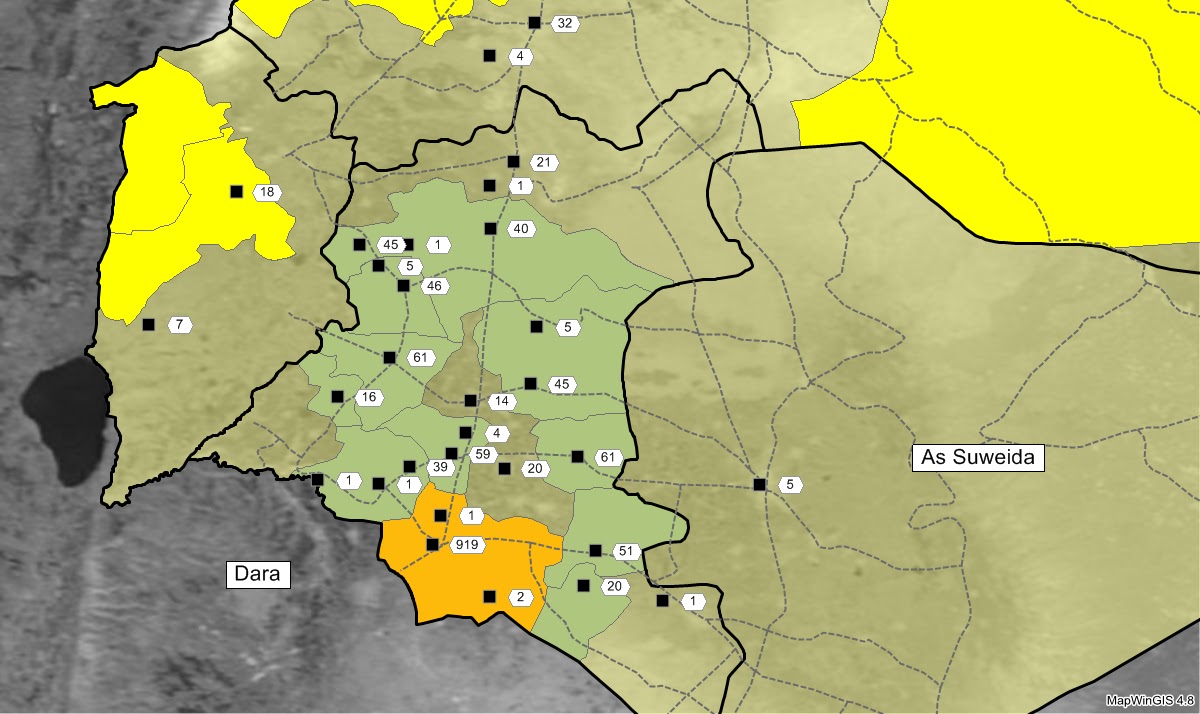
Unfortunately, for the security of those reporting from within Syria, most reports are not fixed to a GPS location. Users that submit reports via the website can graphically indicate a location on the map. Reports by twitter are mapped to the lowest level of detail based on the description and recorded as a Lat Lon. We have used an GIS application to reverse map against shapefiles for the Syrian Administrative districts at levels 1, 2, and 3, and can now correlate death reports with elements from the Syrian 2004 Census, which, although not necessarily the most current, can still provide some understanding.
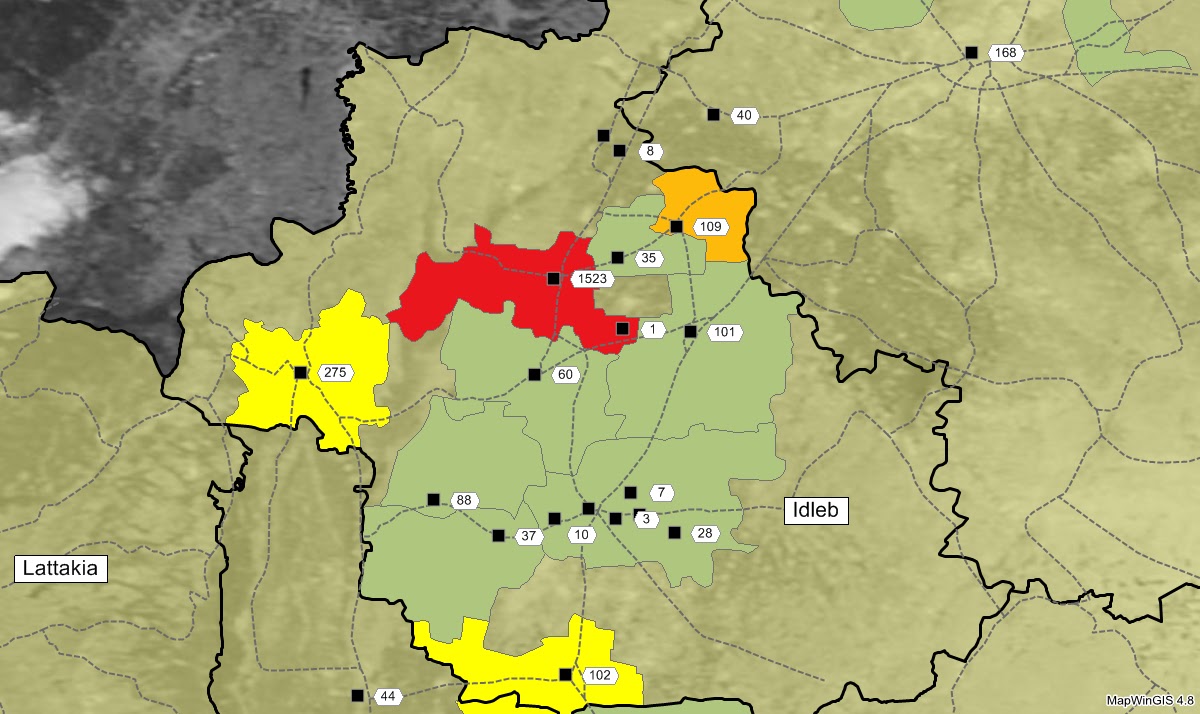
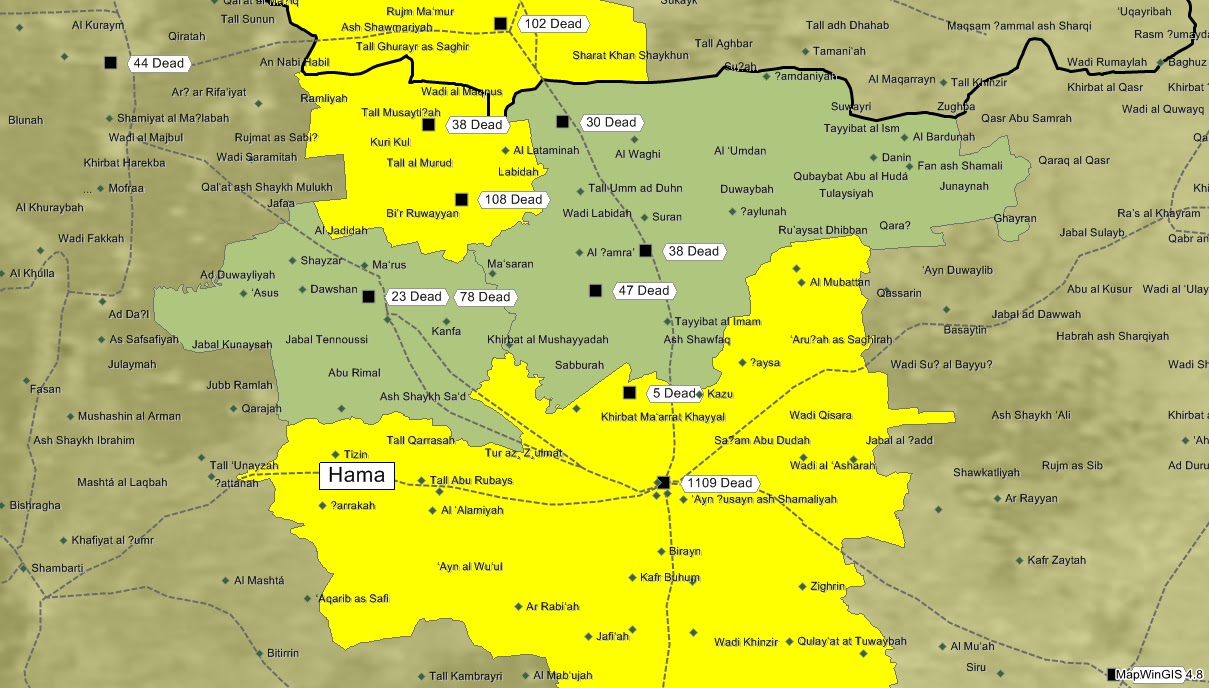
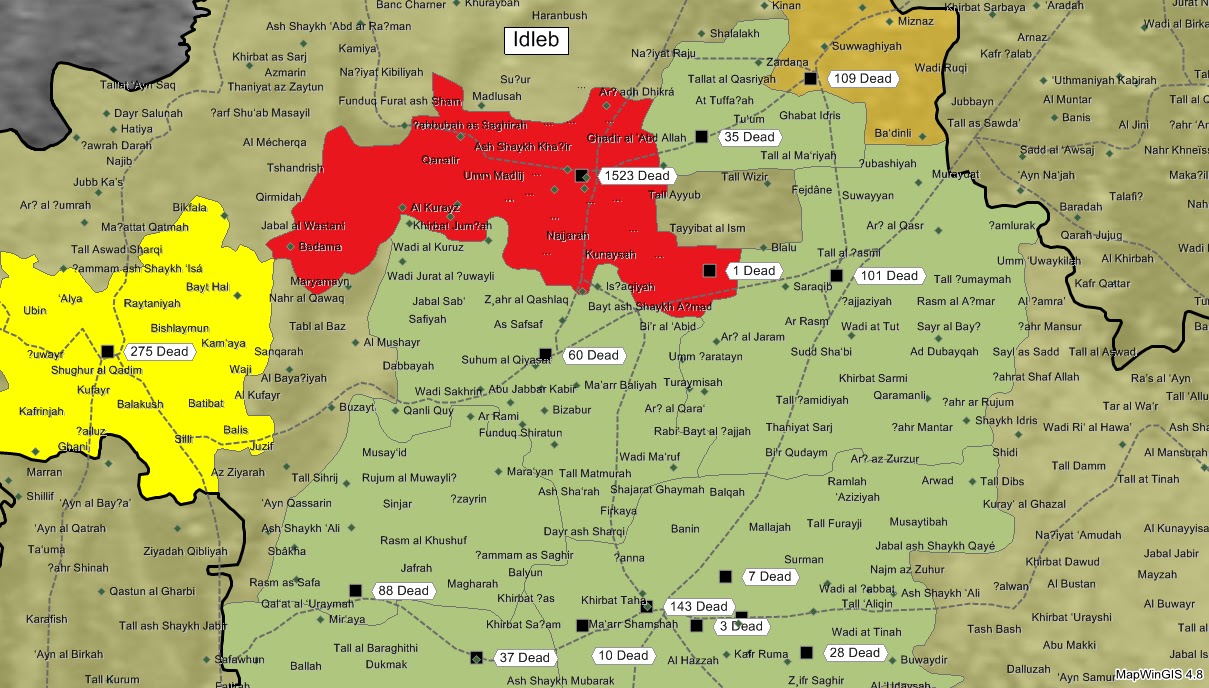
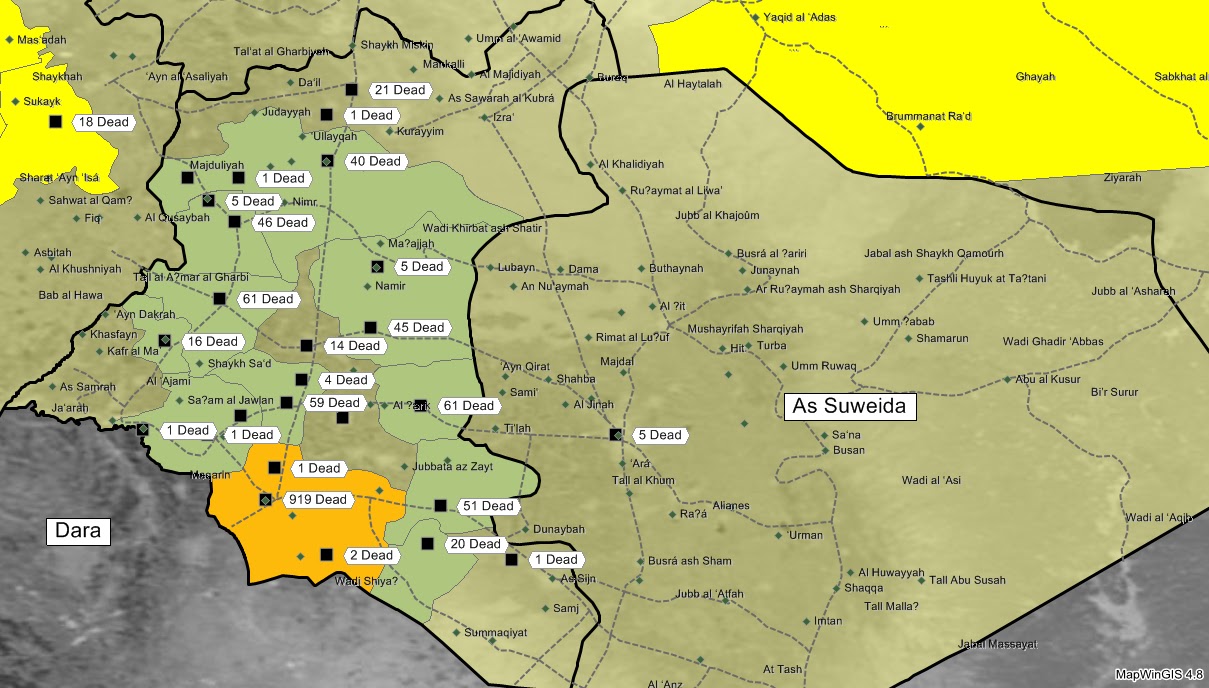
The first question we posed is, among the lowest level (Admin 3) regions (Called a Nahya) which had the highest ratio of reported deaths. We totaled all deaths reported in each Nahya through April 27, 2012 and compared to the 2004 population to get the number of deaths reported for each 10,000 in population. It was a bit of a surprise based on news coverage, but the central region in Idleb suffered 120 deaths per 10,000 pop (in 2004) more than twice of the equivalent in Homs, or any other region. We have several maps—one that shows all of Syria, and color codes those with reported deaths per 10K population from green (low) to high (red).
Please help us document the crimes in Syria at Syria Tracker
Anonymous, if you wish
Instructions for security precautions in English and Arabic
Send an Email: You may submit reports via email
Send a Tweet: adding the hashtag #basharcrimes to your tweet(s)
Location Matters! Please make sure you include the location or geo-location of the report when submitting via email or twitter
Attribution: Syria Tracker in collaboration with Syrian Martyrs


| Credibility: |  |
 |
0 |
Leave a Comment